NVIDIA RTX 4080 tested in Geekbench
Finally, some independent tests of RTX 4080 GPU.

With just 9 days until official launch of RTX 4080 graphics cards, reviewers should now have their cards in hand. This obviously leads to first performance leaks surfacing before the embargo.
According to newly emerged Geekbench data, the upcoming GeForce RTX 4080 has been tested with three different graphics APIs, including Vulkan, OpenCL and CUDA. For us, this is an opportunity to compare the scores to known GPUs, such as RTX 3080 or 3090 Ti. Here is now it stacks up.
The GPU has been tested with a high-end system equipped with ASUS ROG Crosshair X670 Extreme motherboard and Ryzen 9 7950X CPU. A common setup among reviewers. It is correctly recognized as RTX 4080 with 76 Compute Units (Stream Multiprocessors) with 9728 CUDA cores and with 16GB of VRAM. It goes without saying, but this is not the canceled 12GB variant.
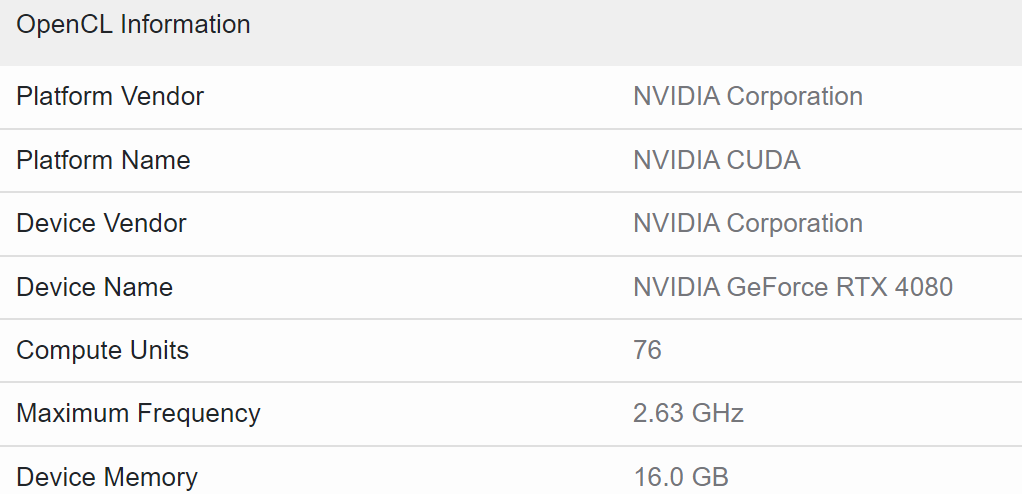
NVIDIA RTX 4080 OpenCL Specs, Source: Geekbench
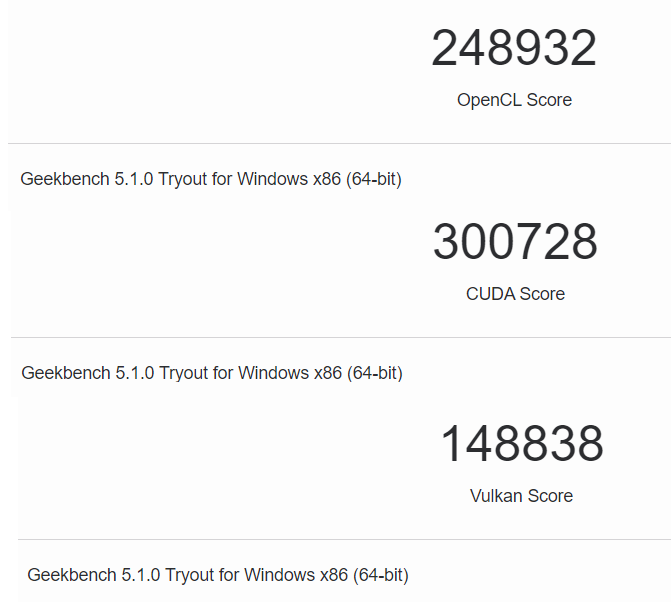
The RTX 4080 scores 248K, 300K and 148K points respectively in OpenCL, CUDA and Vulkan Geekbench API tests.
NVIDIA RTX 4080 Performance, Source: Geekbench
According to the official ranking, the RTX 4080 is 45.7% faster than RTX 3080 in CUDA test, 37.1% faster in OpenCL and 29.9% faster in Vulkan API. In comparison to the fastest Ampere GPU (RTX 3090 Ti) it is 5.4% to 15.5% faster.
Obviously, the Geekbench test is far from accurate comparison for gamers. This is a very short and relatively light test that oftentimes does not even engage the fans on the GPU. So take that into consideration.
| Geekbench V5 GPU Test | |||
|---|---|---|---|
| VideoCardz | CUDA | OpenCL | Vulkan |
| RTX 4090 | |||
| RTX 4080 | |||
| RTX 3090 Ti | |||
| RTX 3090 | |||
| RTX 3080 Ti | |||
| RTX 3080 | |||
| RX 6900 XT | – | ||
| RX 6800 XT | – | ||
| RX 6800 | – | ||
Source: Geekbench (CUDA), (OpenCL), (Vulkan) via @BenchLeaks
