Nearly 47,000 people died of gun-related injuries in the United States in 2023, according to the latest available statistics from the Centers for Disease Control and Prevention (CDC). While the number of gun deaths in the U.S. fell for the second consecutive year, it remained among the highest annual totals on record.
Here’s a closer look at gun deaths in the U.S., based on a Pew Research Center analysis of data from the CDC, the FBI and other sources. You can also read key public opinion findings about U.S. gun violence and gun policy.
Find answers to some common questions:
- How many people die from gun-related injuries in the U.S.?
- What share of U.S. gun deaths are murders? What share are suicides?
- What share of all murders and suicides in the U.S. involve a gun?
- How has the number of U.S. gun deaths changed over time?
- How has the rate of U.S. gun deaths changed over time?
- Which states have the highest and lowest gun death rates in the U.S.?
- How does the gun death rate in the U.S. compare with other countries?
- How many people are killed in mass shootings in the U.S. every year?
- How has the number of mass shootings in the U.S. changed over time?
- Which types of firearms are most commonly used in gun murders in the U.S.?
How many people die from gun-related injuries in the U.S.?
In 2023, the most recent year for which complete data is available, 46,728 people died from gun-related injuries, according to the CDC. That figure includes gun murders and gun suicides, along with three less common types of gun-related deaths the CDC tracks: those that involved law enforcement, those that were accidental, and those whose circumstances could not be determined. The total excludes deaths in which gunshot injuries played a contributing, but not principal, role. (CDC fatality statistics are based on information from official death certificates, which identify a single cause of death.)
What share of U.S. gun deaths are murders? What share are suicides?
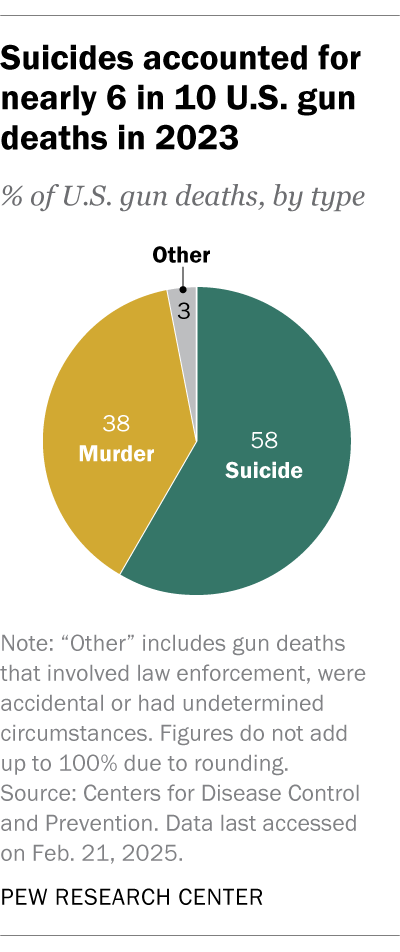
Though they tend to get less public attention than gun-related murders, suicides have long accounted for the majority of U.S. gun deaths. In 2023, 58% of all gun-related deaths in the U.S. were suicides (27,300), while 38% were murders (17,927). The remaining gun deaths that year involved law enforcement (604), were accidental (463) or had undetermined circumstances (434), according to CDC data.
What share of all murders and suicides in the U.S. involve a gun?
About eight-in-ten U.S. murders in 2023 – 17,927 out of 22,830, or 79% – involved a firearm. That was among the highest percentages since 1968, the earliest year for which the CDC has online records.
More than half of all suicides in 2023 – 27,300 out of 49,316, or 55% – also involved a gun. That was one of the highest percentages since 2000, when 57% of suicides involved a firearm.
How has the number of U.S. gun deaths changed over time?
The number of gun deaths in 2023 (46,278) was the third-highest total on record, trailing only the two previous years. There were 48,204 such deaths in 2022 and a record 48,830 in 2021.
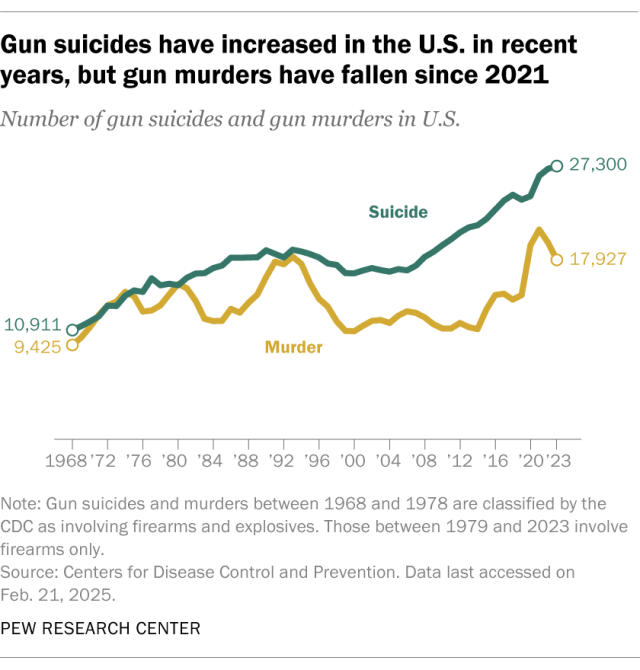
Gun murders rose dramatically during the coronavirus pandemic but have declined substantially in more recent years. The number of gun murders fell from a record 20,958 in 2021 to 17,927 in 2023, a 14% decrease.
Gun suicides, on the other hand, have been on a mostly upward trajectory for most of the last two decades and peaked in 2023 with 27,300 such fatalities.
How has the rate of U.S. gun deaths changed over time?
While the overall number of gun deaths in the U.S. was among the highest on record in 2023, this statistic does not account for the nation’s growing population.
On a per capita basis, there were 13.7 gun deaths per 100,000 people in 2023. That was down from 14.2 per 100,000 in 2022 and 14.6 per 100,000 in 2021, and well below the peak of 16.3 per 100,000 in 1974.
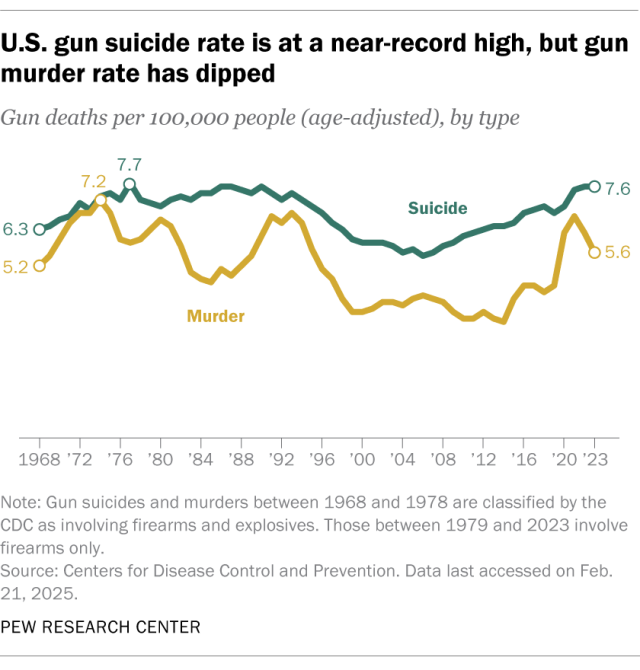
The decline in the gun death rate since 2021 is mostly due to a decrease in the rate of gun murders. There were 5.6 gun murders per 100,000 people in 2023. That was down from 6.2 per 100,000 in 2022 and 6.7 per 100,000 in 2021. The gun murder rate peaked at 7.2 per 100,000 in 1974.
The gun suicide rate, on the other hand, is now on par with its all-time high. There were 7.6 gun suicides per 100,000 people in 2023, about equal to the record 7.7 per 100,000 in 1977.
(One caveat when considering the 1970s figures: In the CDC’s database, gun murders and gun suicides between 1968 and 1978 are classified as those caused by firearms and explosives. In subsequent years, they are classified as deaths involving firearms only.)
Which states have the highest and lowest gun death rates in the U.S.?
The rate of gun fatalities varies widely from state to state. In 2o23, the places with the highest total rates of gun-related deaths – counting murders, suicides and all other categories the CDC tracks – included the District of Columbia (30.6 per 100,000 people), Mississippi (29.4), Louisiana (28.3), Alabama (25.6) and New Mexico (25.3).
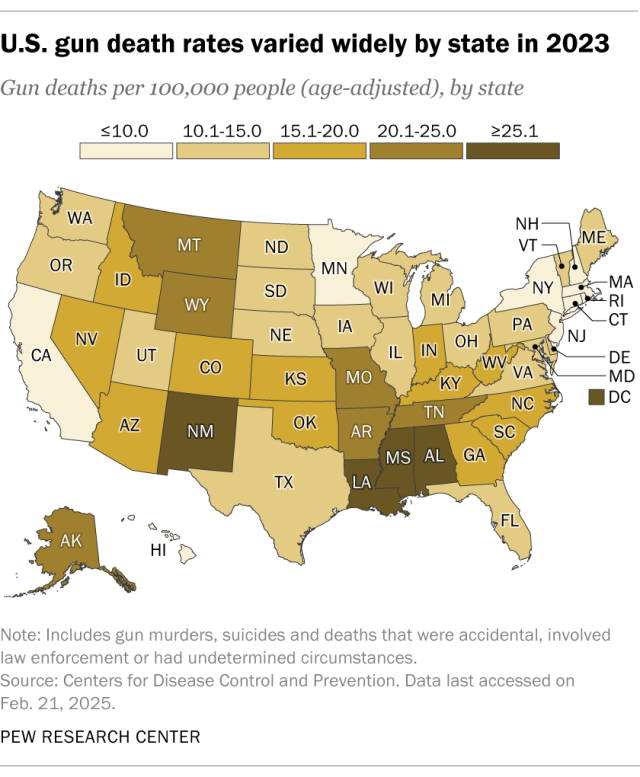
The states with the lowest total rates included Massachusetts (3.7), New Jersey (4.6), New York (4.7), Rhode Island (4.8) and Hawaii (4.9).
The results are somewhat different when looking at gun murder and gun suicide rates separately. The places with the highest gun murder rates in 2023 included the District of Columbia (28.5 per 100,000 people), Mississippi (17.6), Louisiana (17.2), Alabama (13.2) and New Mexico (11.1).
Those with the lowest gun murder rates included Hawaii (1.5), Utah (1.8), Nebraska (1.8), Idaho (1.8) and Massachusetts (1.8). Rate estimates are not available for New Hampshire, North Dakota, Rhode Island, South Dakota, Vermont and Wyoming.
The places with the highest gun suicide rates in 2023 included Wyoming (19.0 per 100,000 people), Montana (17.6), Alaska (16.0), Idaho (15.1) and Oklahoma (13.6).
The states with the lowest gun suicide rates included Massachusetts (1.9), New Jersey (2.1), New York (2.2), Connecticut (2.8) and Rhode Island (3.0). Rate estimates are not available for the District of Columbia.
In this analysis, all rates are adjusted to account for age differences across states.
How does the gun death rate in the U.S. compare with other countries?
The gun death rate in the U.S. is much higher than in most other nations, particularly developed nations. But it is still far below the rates in several Latin American countries, according to a 2018 study of 195 countries and territories by researchers at the Institute for Health Metrics and Evaluation at the University of Washington.
The U.S. gun death rate was 10.6 per 100,000 people in 2016, the most recent year in the study, which used a somewhat different methodology from the CDC. That was far higher than in countries such as Canada (2.1 per 100,000) and Australia (1.0), as well as European nations such as France (2.7), Germany (0.9) and Spain (0.6).
But it was much lower than in El Salvador (39.2 per 100,000 people), Venezuela (38.7), Guatemala (32.3), Colombia (25.9) and Honduras (22.5). Overall, the U.S. ranked 20th in its gun fatality rate that year, the study found.
How many people are killed in mass shootings in the U.S. every year?
This is a difficult question to answer because there is no single, agreed-upon definition of the term “mass shooting.” Definitions can vary depending on factors including the number of victims and the circumstances of the shooting.
The FBI collects data on “active shooter incidents,” which it defines as “one or more individuals actively engaged in killing or attempting to kill people in a populated area.” Using the FBI’s definition, 105 people – excluding the shooters – died in such incidents in 2023.
The Gun Violence Archive, an online database of gun violence incidents in the U.S., defines mass shootings as incidents in which four or more people are shot, even if no one was killed (again excluding the shooters). Using this definition, 722 people died in these incidents in 2023.
Regardless of the definition being used, fatalities in mass shooting incidents in the U.S. are a small fraction of all gun murders nationwide each year.
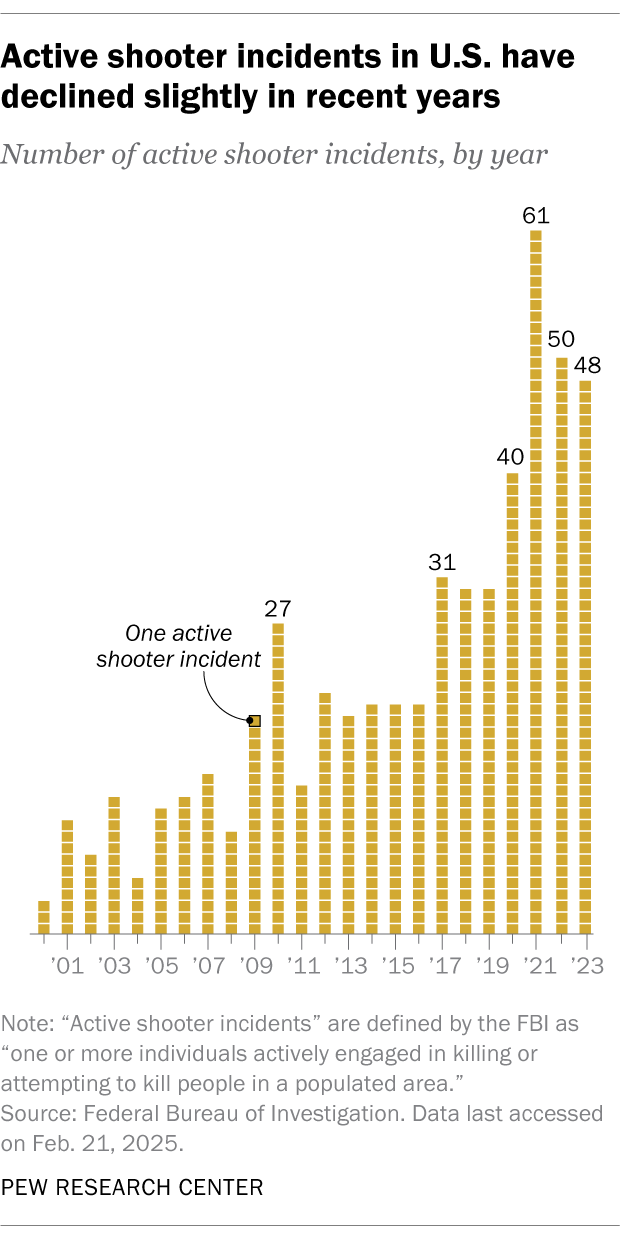
How has the number of mass shootings in the U.S. changed over time?
The same definitional issue that makes it challenging to calculate mass shooting fatalities comes into play when trying to determine the frequency of U.S. mass shootings over time.
The unpredictability of these incidents also complicates matters. As RAND noted in a research brief, “Chance variability in the annual number of mass shooting incidents makes it hard to discern a clear trend in the risk of such incidents, and trend estimates are sensitive to outliers and to the time frame chosen for analysis.”
The FBI found an increase in active shooter incidents between 2000 and 2023. There were three such incidents in 2000. By 2023, that figure had increased to 48.
Which types of firearms are most commonly used in gun murders in the U.S.?
In 2023, the most recent year for which the FBI has published data, handguns were involved in 53% of the 13,529 U.S. gun murders and non-negligent manslaughters for which data is available. Rifles – the category that includes guns sometimes referred to as “assault weapons” – were involved in 4% of firearm murders. Shotguns were involved in 1%. The remainder of gun homicides and non-negligent manslaughters (42%) involved other kinds of firearms or those classified as “type not stated.”
It’s important to note that the FBI’s statistics do not capture the details of all gun murders in the U.S. each year. The FBI’s data is based on information voluntarily submitted by police departments around the country, and not all agencies participate or provide complete information each year.
Note: This is an update of a post originally published on Aug. 16, 2019.
