Markets
Does America View Its Trade Relationships as Fair?
Does America View Its Trade Relationships as Fair?
The Chart of the Week is a weekly Visual Capitalist feature on Fridays.
Understandably, most people are not experts on the subject of trade.
But while the average person won’t likely be able to guess the U.S. trade deficit with Mexico, perceptions of trade relationships in the public eye are still a crucial indicator.
If the majority of Americans think they are getting the short end of the stick on international trade, this sentiment ultimately affects how politicians campaign, how policy decisions are made, and the success of the wider economy.
U.S. Perceptions of Trade
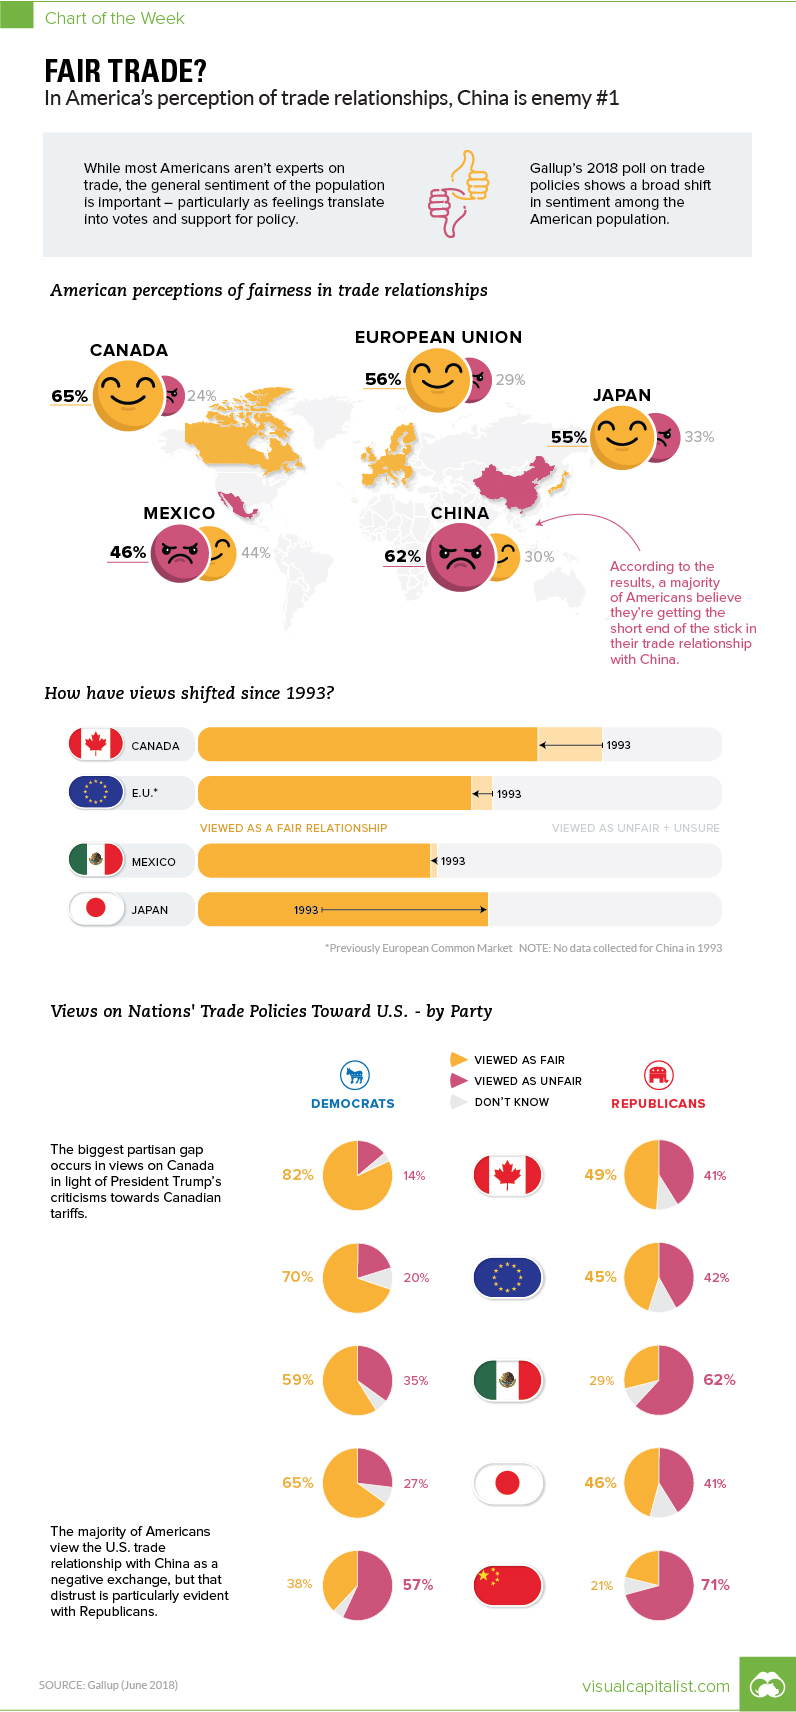
In today’s chart, we break down the data from a recent Gallup poll on how Americans view the country’s trade relationships.
At a high level, here is how it looks by country:
| U.S. Trade Partner | Fair | Unfair | Don't know / No opinion |
|---|---|---|---|
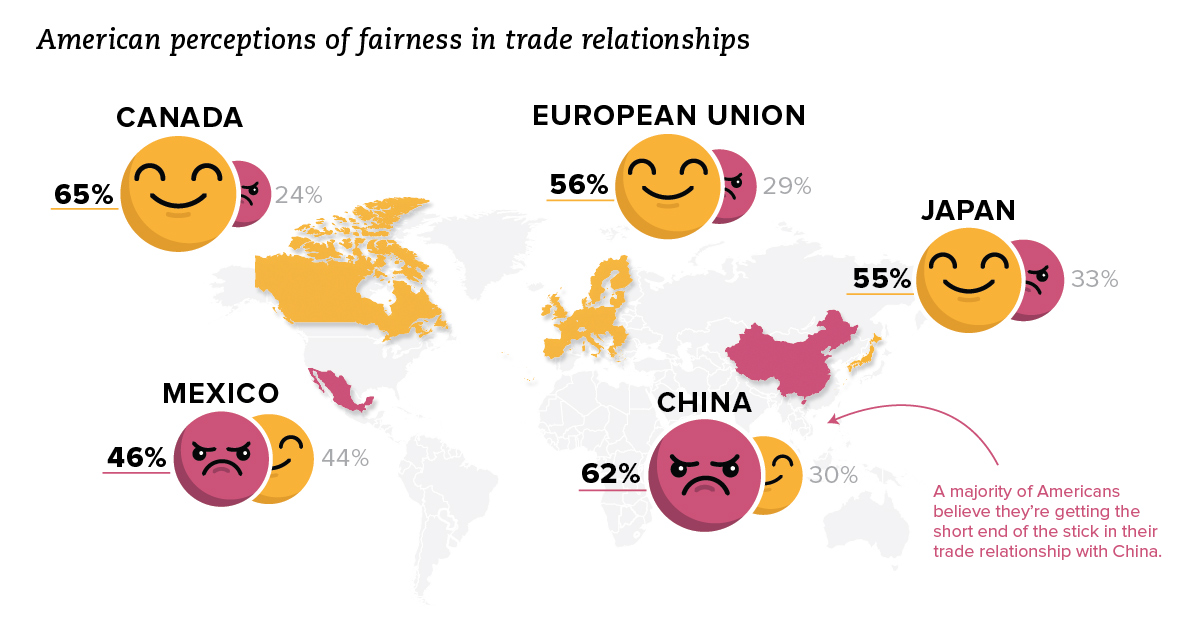
| Canada | 65% | 24% | 10% |
| European Union | 56% | 29% | 15% |
| Japan | 55% | 33% | 12% |
| Mexico | 44% | 46% | 11% |
| China | 30% | 62% | 9% |
Source: Gallup, June 18-24, 2018
The majority of Americans think relationships with Canada (65%), the European Union (56%), and Japan (55%) are fair. When it comes to Mexico, respondents are split (44% fair, 46% unfair).
Meanwhile, it’s clear that most Americans think they are getting the short end of the stick with China, with 62% of respondents describing the relationship as unfair.
The China Problem
China is America’s largest trading partner, so this negative sentiment has meaningful implications.
The balance of trade that the U.S. has with China is also crystal clear: in 2017, the two countries traded $636 billion of goods, but the vast majority of this number comes from Chinese imports into the United States:
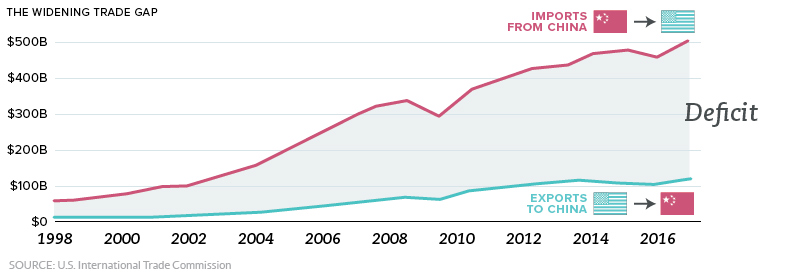
Most economists actually think that trade deficits are less important than they appear, but this trade gap is also visceral for many people. After all, U.S. exports barely make a dent in the mix, and this sends a message that America is “losing”.
Between the above trade deficit, intellectual property issues, and jobs going overseas, it’s understandable why the perception of Chinese-U.S. trade is under fire in terms of public sentiment.
And with the start of the recent trade war, the view on China could sour even further.
The Partisan Perspective
Interestingly, Democrats and Republicans have very different views on U.S. relationships, including the one with China:
| U.S. Trade Partner | Fair (Democrats) | Fair (Republicans) |
|---|---|---|
| Canada | 82% | 49% |
| European Union | 70% | 42% |
| Japan | 65% | 46% |
| Mexico | 59% | 29% |
| China | 38% | 21% |
Source: Gallup, June 18-24, 2018
Comparing Republicans and Democrats, three different relationships have opinion gaps of about 30%: Canada, European Union, and Mexico. In all cases, Democrats favored the relationships far more than Republicans.
That said, when it comes to China and Japan, the parties are slightly more aligned.
Only a minority in both parties thought the U.S. trade relationship with China was fair, with 21% of Republicans and 38% of Democrats in agreement.


Markets
The European Stock Market: Attractive Valuations Offer Opportunities
On average, the European stock market has valuations that are nearly 50% lower than U.S. valuations. But how can you access the market?


European Stock Market: Attractive Valuations Offer Opportunities
Europe is known for some established brands, from L’Oréal to Louis Vuitton. However, the European stock market offers additional opportunities that may be lesser known.
The above infographic, sponsored by STOXX, outlines why investors may want to consider European stocks.
Attractive Valuations
Compared to most North American and Asian markets, European stocks offer lower or comparable valuations.
| Index | Price-to-Earnings Ratio | Price-to-Book Ratio |
|---|---|---|
| EURO STOXX 50 | 14.9 | 2.2 |
| STOXX Europe 600 | 14.4 | 2 |
| U.S. | 25.9 | 4.7 |
| Canada | 16.1 | 1.8 |
| Japan | 15.4 | 1.6 |
| Asia Pacific ex. China | 17.1 | 1.8 |
Data as of February 29, 2024. See graphic for full index names. Ratios based on trailing 12 month financials. The price to earnings ratio excludes companies with negative earnings.
On average, European valuations are nearly 50% lower than U.S. valuations, potentially offering an affordable entry point for investors.
Research also shows that lower price ratios have historically led to higher long-term returns.
Market Movements Not Closely Connected
Over the last decade, the European stock market had low-to-moderate correlation with North American and Asian equities.
The below chart shows correlations from February 2014 to February 2024. A value closer to zero indicates low correlation, while a value of one would indicate that two regions are moving in perfect unison.
| EURO STOXX 50 | STOXX EUROPE 600 | U.S. | Canada | Japan | Asia Pacific ex. China |
|
|---|---|---|---|---|---|---|
| EURO STOXX 50 | 1.00 | 0.97 | 0.55 | 0.67 | 0.24 | 0.43 |
| STOXX EUROPE 600 | 1.00 | 0.56 | 0.71 | 0.28 | 0.48 | |
| U.S. | 1.00 | 0.73 | 0.12 | 0.25 | ||
| Canada | 1.00 | 0.22 | 0.40 | |||
| Japan | 1.00 | 0.88 | ||||
| Asia Pacific ex. China | 1.00 |
Data is based on daily USD returns.
European equities had relatively independent market movements from North American and Asian markets. One contributing factor could be the differing sector weights in each market. For instance, technology makes up a quarter of the U.S. market, but health care and industrials dominate the broader European market.
Ultimately, European equities can enhance portfolio diversification and have the potential to mitigate risk for investors.
Tracking the Market
For investors interested in European equities, STOXX offers a variety of flagship indices:
| Index | Description | Market Cap |
|---|---|---|
| STOXX Europe 600 | Pan-regional, broad market | €10.5T |
| STOXX Developed Europe | Pan-regional, broad-market | €9.9T |
| STOXX Europe 600 ESG-X | Pan-regional, broad market, sustainability focus | €9.7T |
| STOXX Europe 50 | Pan-regional, blue-chip | €5.1T |
| EURO STOXX 50 | Eurozone, blue-chip | €3.5T |
Data is as of February 29, 2024. Market cap is free float, which represents the shares that are readily available for public trading on stock exchanges.
The EURO STOXX 50 tracks the Eurozone’s biggest and most traded companies. It also underlies one of the world’s largest ranges of ETFs and mutual funds. As of November 2023, there were €27.3 billion in ETFs and €23.5B in mutual fund assets under management tracking the index.
“For the past 25 years, the EURO STOXX 50 has served as an accurate, reliable and tradable representation of the Eurozone equity market.”
— Axel Lomholt, General Manager at STOXX
Partnering with STOXX to Track the European Stock Market
Are you interested in European equities? STOXX can be a valuable partner:
- Comprehensive, liquid and investable ecosystem
- European heritage, global reach
- Highly sophisticated customization capabilities
- Open architecture approach to using data
- Close partnerships with clients
- Part of ISS STOXX and Deutsche Börse Group
With a full suite of indices, STOXX can help you benchmark against the European stock market.
Learn how STOXX’s European indices offer liquid and effective market access.

-

 Economy1 day ago
Economic Growth Forecasts for G7 and BRICS Countries in 2024
The IMF has released its economic growth forecasts for 2024. How do the G7 and BRICS countries compare?
-

 Markets1 week ago
U.S. Debt Interest Payments Reach $1 Trillion
U.S. debt interest payments have surged past the $1 trillion dollar mark, amid high interest rates and an ever-expanding debt burden.
-

 United States2 weeks ago
Ranked: The Largest U.S. Corporations by Number of Employees
We visualized the top U.S. companies by employees, revealing the massive scale of retailers like Walmart, Target, and Home Depot.
-

 Markets2 weeks ago
The Top 10 States by Real GDP Growth in 2023
This graphic shows the states with the highest real GDP growth rate in 2023, largely propelled by the oil and gas boom.
-

 Markets2 weeks ago
Ranked: The World’s Top Flight Routes, by Revenue
In this graphic, we show the highest earning flight routes globally as air travel continued to rebound in 2023.
-

 Markets2 weeks ago
Ranked: The Most Valuable Housing Markets in America
The U.S. residential real estate market is worth a staggering $47.5 trillion. Here are the most valuable housing markets in the country.


-

 Mining1 week ago
Gold vs. S&P 500: Which Has Grown More Over Five Years?
-
Markets2 weeks ago
Ranked: The Most Valuable Housing Markets in America
-

 Money2 weeks ago
Which States Have the Highest Minimum Wage in America?
-

 AI2 weeks ago
Ranked: Semiconductor Companies by Industry Revenue Share
-
Markets2 weeks ago
Ranked: The World’s Top Flight Routes, by Revenue
-

 Demographics2 weeks ago
Population Projections: The World’s 6 Largest Countries in 2075
-
Markets2 weeks ago
The Top 10 States by Real GDP Growth in 2023
-

 Demographics2 weeks ago
The Smallest Gender Wage Gaps in OECD Countries